
Streamlining Peripheral Nerve Axon Histomorphometry Using Machine Learning
Alison L Wong, MD, MSE, FRCSC1, Harsha Malapati, BS1, Nicholas Hricz, BS1, Nicholas von Guionneau, MBBS1, Michael J Wong, MD2, Thomas G.W. Harris, MBBS1, Mathieu Boudreau, PhD3, Julien Cohen-Adad, PhD3 and Sami Tuffaha, MD4, (1)Johns Hopkins University School of Medicine, Baltimore, MD, (2)Dalhousie University, Halifax, NS, Canada, (3)Polytechnique Montreal, Montreal, QC, Canada, (4)Department of Plastic and Reconstructive Surgery, Johns Hopkins University School of Medicine, Baltimore, MD
Introduction
Axon histomorphometry (AH) is the most commonly used histological outcome measure in evaluating peripheral nerves. Manual AH remains the gold-standard, but this is both time- and resource-intensive. AxonDeepSeg (ADS) is a novel deep learning program trained on transmission electron micrographs that recognizes axons and performs histomorphometry automatically. We tested whether ADS could be used with light micrographs to perform reliable AH comparable to manual analysis.
Materials & Methods
AH was performed on light micrographs of rat median nerve cross-sections to evaluate the comparability of results generated with ADS versus manual counting (gold-standard) with both osmium/paraffin and toluidine blue/resin protocols. Cross-sections were imaged at x100 magnification, with a single nerve slice captured in 12-13 micrographs. Manual analysis was performed in ImageJ and following stereological principles, a 25x25 µm area at the center of each micrograph was sampled. The same micrographs were analyzed in ADS (Fig.1). Axon measurements for the entire micrograph were generated but only those within the same coordinates as in the manual analysis were used. The comparability of axon count was evaluated using a Bland-Altman plot and intraclass correlation (ICC). G-ratio, myelin thickness and axon diameter were compared using two sample t-tests and Cohen's d for effect size.
Results
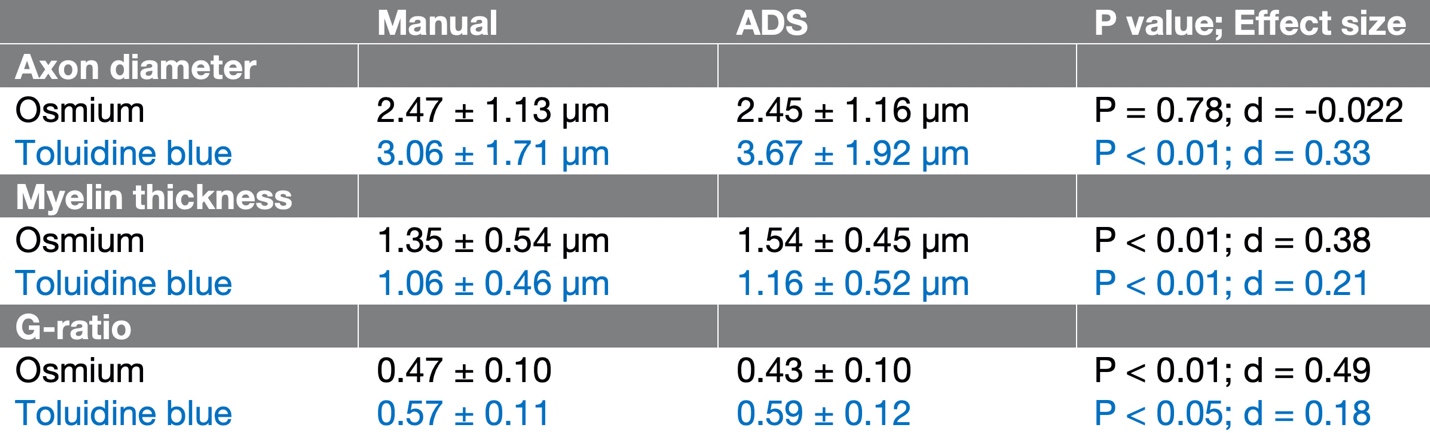
ADS was significantly faster than manual measurement, taking an average of 20 seconds on a standard laptop computer. Manual and ADS axon counts demonstrated good agreement (Fig.2). There were statistically significant differences in axon diameter, myelin thickness and g-ratio (Table.1); however, absolute differences and effect sizes were small (d<0.5).
Conclusions
ADS provided comparable counts, and small but consistent differences in measurements. It required much less time than manual counting. ADS is a promising tool for AH and future work should focus on additional training of the neural network for optimization for light microscopy.
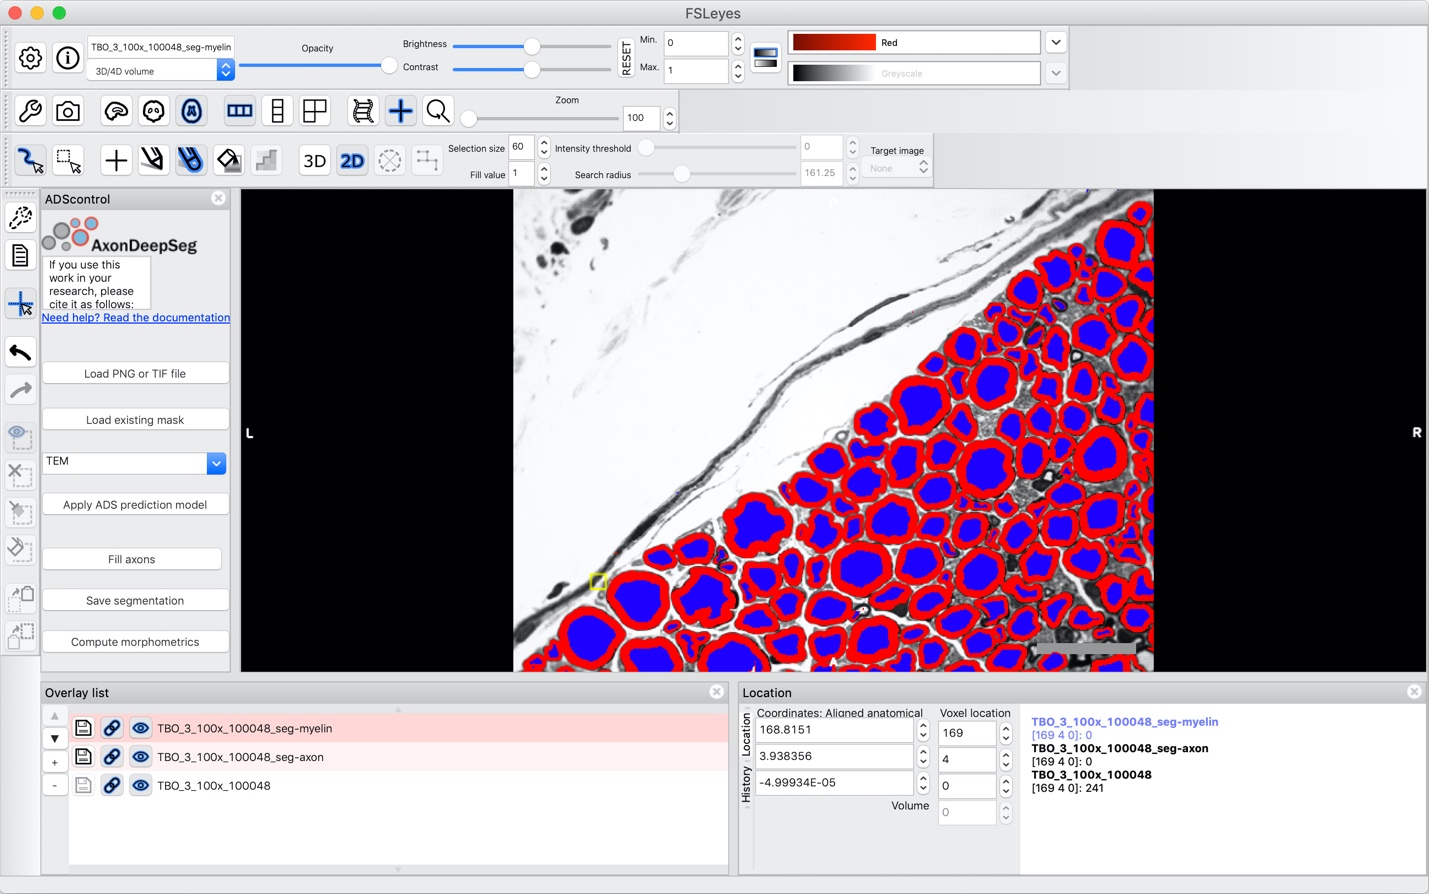
Fig 1. ADS user interface and representative axon segmentation.
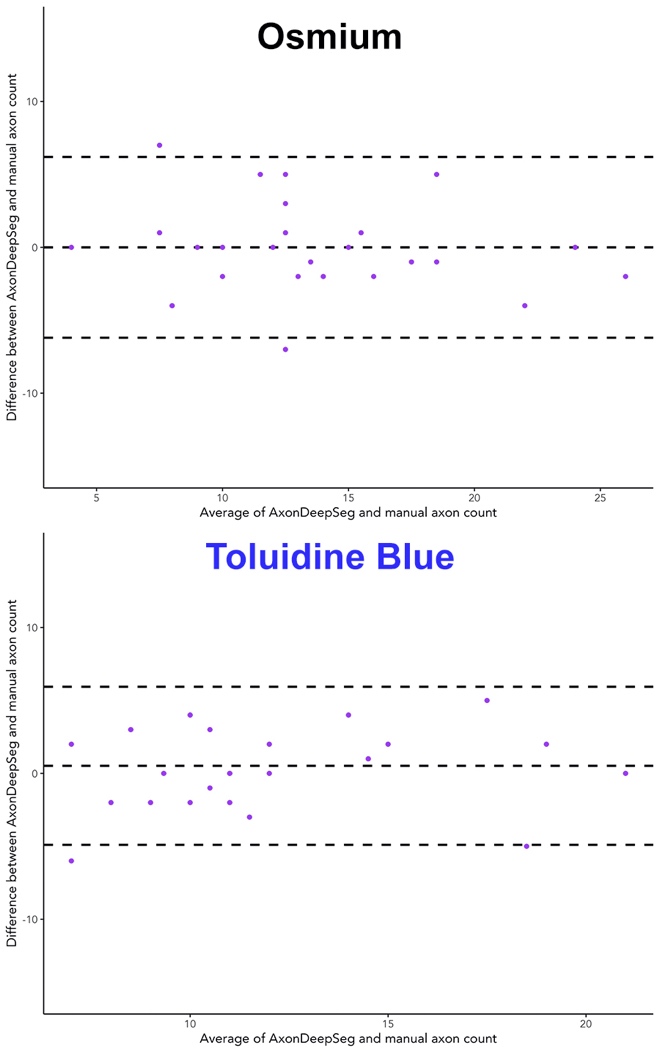
Fig 2. Bland-Altman plots demonstrating good agreement between axon counts in both osmium and toluidine blue micrographs.
Table 1. Axon histomorphometry measurements from manual and AxonDeepSeg (ADS) analysis.
Back to 2021 Abstracts